Data at Depth

Data at Depth

Share this post

Data at Depth
Data at Depth
Who’s Happy Now? Creating an Interactive Dashboard with Python & Solara

Who’s Happy Now? Creating an Interactive Dashboard with Python & Solara

Visualizing global happiness stats with interactive data visuals

John Loewen's avatar
John Loewen
Mar 29, 2025
∙ Paid
3

Share this post

Data at Depth
Data at Depth
Who’s Happy Now? Creating an Interactive Dashboard with Python & Solara
Share

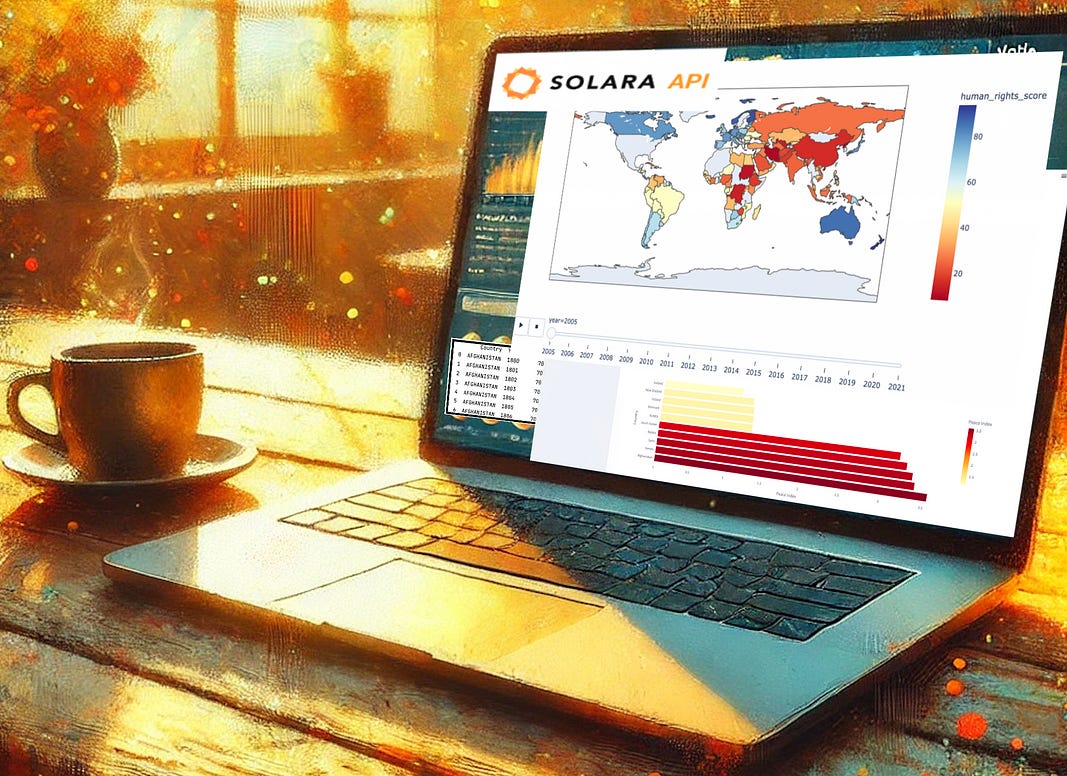
With Python and Solara, you can create dynamic, interactive dashboards to visualize global data.

Solara is an interactive app framework that allows you to build applications directly in Python — without needing any front-end web development experience.

Data at Depth is a reader-supported publication. To receive new posts and support my work, consider beco…

Keep reading with a 7-day free trial

Subscribe to Data at Depth to keep reading this post and get 7 days of free access to the full post archives.

Already a paid subscriber? Sign in
© 2025 John Loewen
Privacy ∙ Terms ∙ Collection notice
Start writingGet the app
Substack is the home for great culture

Share