
Who is Most Generous? A Simple Python Streamlit Radar Chart On Global Giving
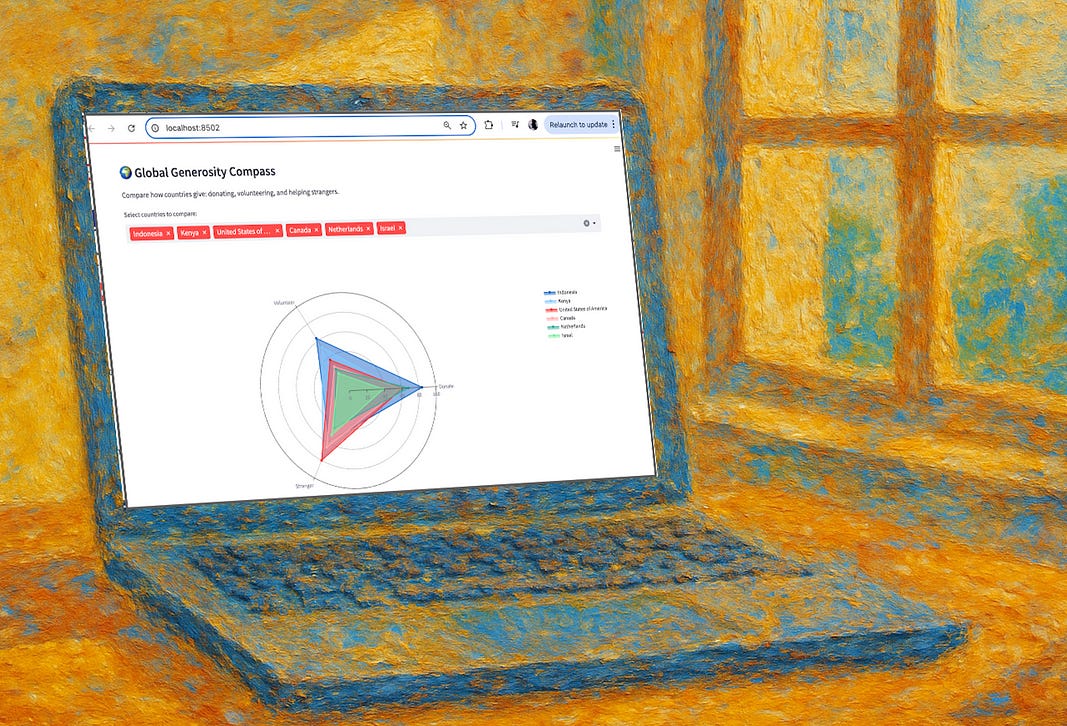
A how-to tutorial on n visualizing global giving data with Python and Plotly

When we talk about generosity, we often fall into lazy assumptions.
For example, the assumptions that rich countries must give more and that certain regions must be inherently more charitable.
But data rarely supports the…
Keep reading with a 7-day free trial
Subscribe to Data at Depth to keep reading this post and get 7 days of free access to the full post archives.