


Visual Storytelling in Python: 5 Innovative Hacks to Make Your Data Speak
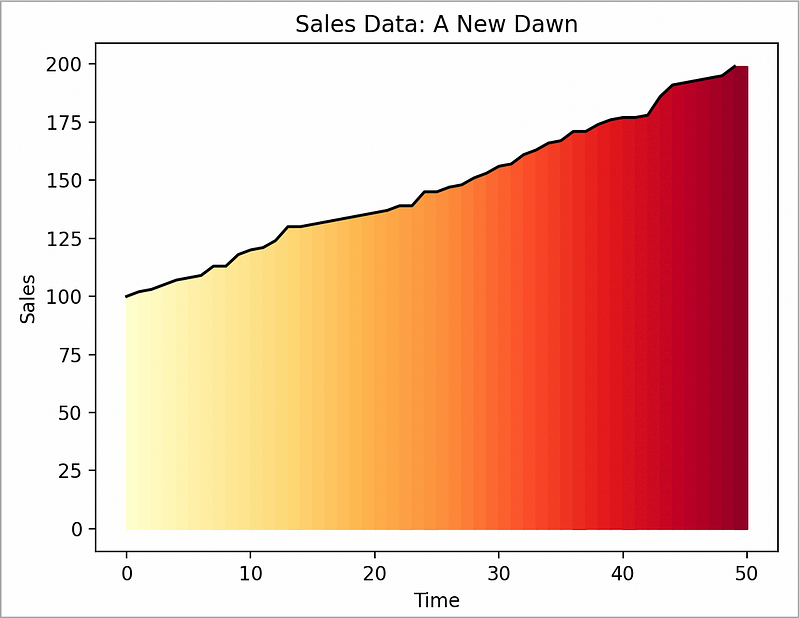
Adding drama to your data visualizations

Adding drama to your data visualizations
Hey, Pythonistas! Data visualization — it is a phrase that gets thrown around quite a lot these days. But we’re not just talking about plain old charts and graphs.
No, no, no. We’re talking about storytelling. We’re talking about turning those rows and columns of numbers into captivating narratives that stick.
It’s …
Keep reading with a 7-day free trial
Subscribe to Data at Depth to keep reading this post and get 7 days of free access to the full post archives.