Data at Depth

Data at Depth

Share this post

Data at Depth
Data at Depth
Three Powerful Multi-Function Python Visuals That Make Your Data Speak

Three Powerful Multi-Function Python Visuals That Make Your Data Speak

Three classic multi-functioning data visualization examples using Python

John Loewen's avatar
John Loewen
Dec 16, 2024
∙ Paid
2

Share this post

Data at Depth
Data at Depth
Three Powerful Multi-Function Python Visuals That Make Your Data Speak
1
Share

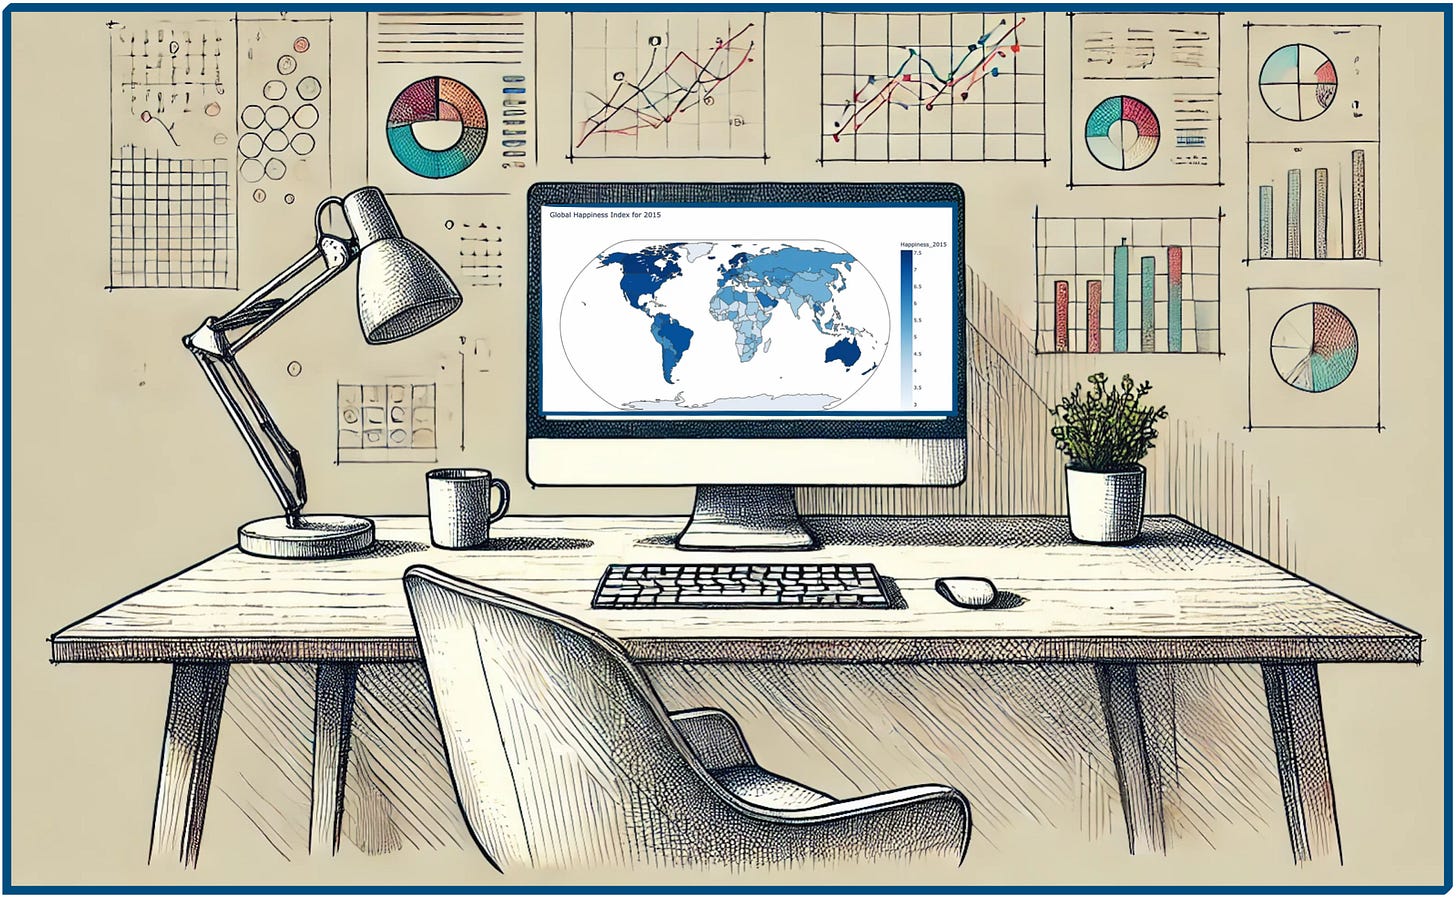
Graphical representations on a chart or graph can serve more than one purpose.

To optimize your visual display, you can apply multiple functions into your graphical elements to present complex data within a limited space.

Data at Depth is a reader-supported publication. To receive new posts and support my work, consider becoming a free or paid subscriber.

Keep reading with a 7-day free trial

Subscribe to Data at Depth to keep reading this post and get 7 days of free access to the full post archives.

Already a paid subscriber? Sign in
© 2025 John Loewen
Privacy ∙ Terms ∙ Collection notice
Start writingGet the app
Substack is the home for great culture

Share