Sharpen Your Data Storytelling Skills With The Python PyNarrative Library
A how-to on using PyNarrative’s simple API to add context to your data visuals
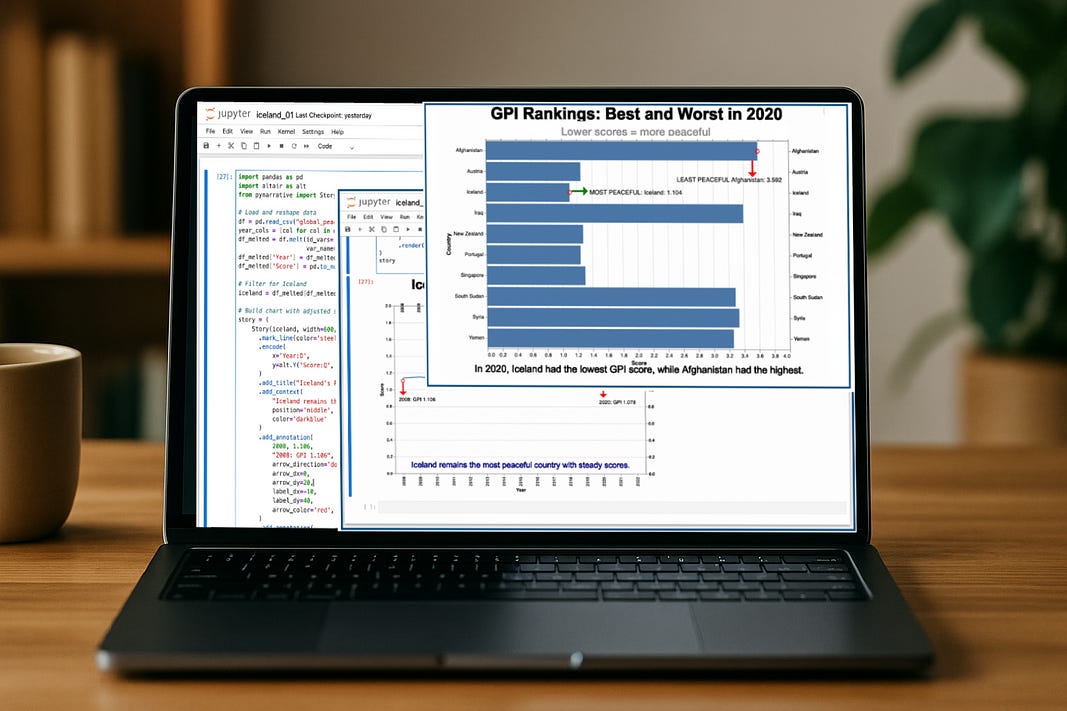
PyNarrative, a Python library built on Altair, helps data scientists easily add narration and explanation directly into their data visuals
How easy is this process with Pynarrative? This tutorial walks through three real examples using the Global Peace Index (GPI) dataset: a time-series line chart, a ranked bar chart, and a comparison of GPI score change…
Keep reading with a 7-day free trial
Subscribe to Data at Depth to keep reading this post and get 7 days of free access to the full post archives.


