
Boosting Data Visualization Productivity With ChatGPT, Python & Streamlit
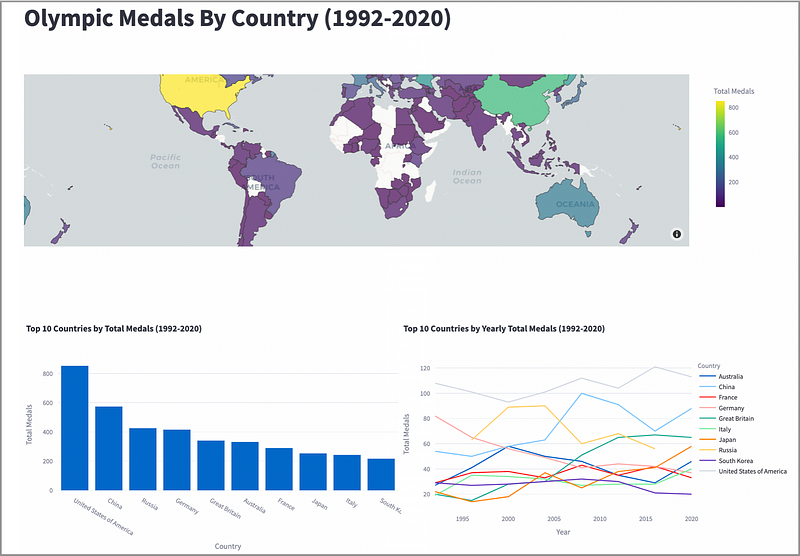
Maps and charts with GPT4-generated Python code

Maps and charts with GPT4-generated Python code
With ChatGPT, even a complete beginner can use a Python library like streamlit to easily create a data visualization application.
I am a decent (not outstanding) Python coder with ZERO experience using streamlit and I acco…
Keep reading with a 7-day free trial
Subscribe to Data at Depth to keep reading this post and get 7 days of free access to the full post archives.