Is GPT-4o Now Any Better With Data Visualization Report Creation?
Testing GPT-4o data viz automatic PDF report generation using a UN dataset
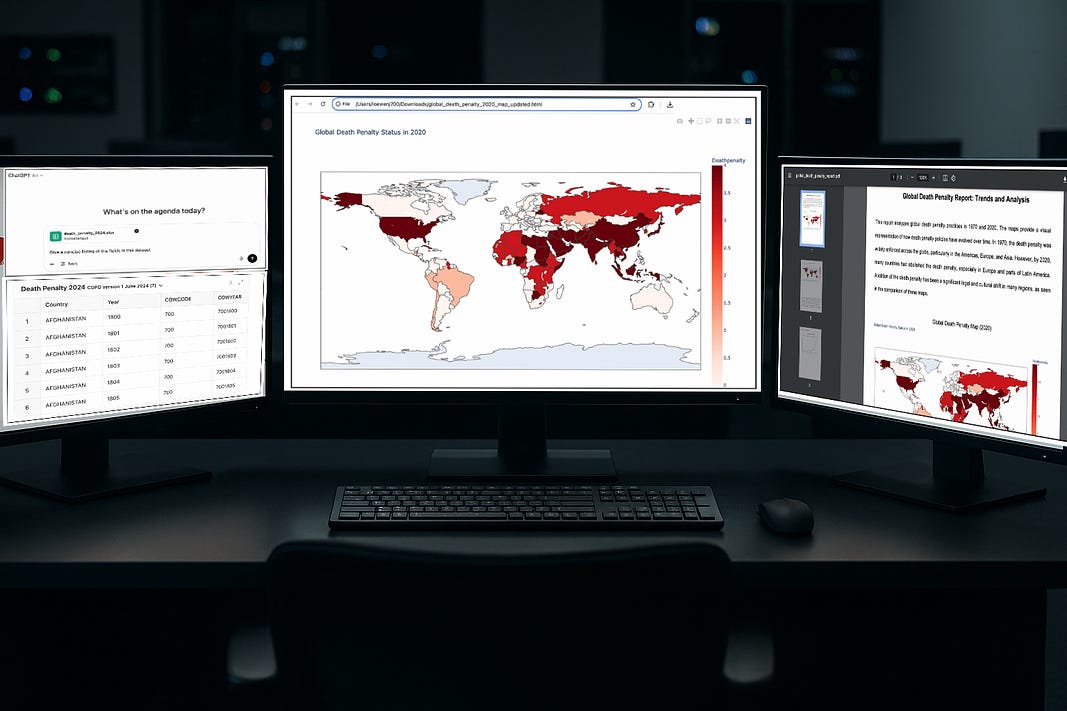
GPT-4o, as one of the most powerful large language models, can analyze data, generate data visuals, and create PDF reports from complex datasets.
For example, you can ask the LLM to access and provide information about each data field in your spreadsheet files and it will respond quickly and accurately.
It excels in so many areas of data manipulation and reporting. But are there still some significant limitations?
Let’s find out by taking a look together at what GPT-4o does well and where it suffers — all with practical examples using a current global dataset.
The Dataset
The Harvard Comparative Death Penalty Database provides a global yearly categorization of death penalty status.
This dataset includes both historical and modern data, allowing us to track how the use of the death penalty has changed globally over time.
The dataset can be downloaded HERE.
Bringing death penalty data to life shows us where the world stands on one of the most controversial practices in the legal system.
So let’s take a deeper look at how GPT-4o capabilities can be leveraged to automate and expedite data visual generation and reporting tasks.
Data Viz Reporting — What Can GPT-4o Do Well?
1. Reading and Analyzing CSV Data
One of the key strengths of GPT-4o is its ability to quickly read, interpret, and analyze data from CSV files.
This LLM keeps getting better with the accuracy and detail that it provides. Whether it’s a dataset containing happiness scores, death penalty data, or any other structured format, GPT-4o can parse the CSV file top to bottom and make the data accessible for further analysis and visualization.
One of the most useful ways that it provides is via Python Pandas dataframe generation. Once the dataset is converted into a data frame, this opens up so many options for data visualization generation.
Let me whow you how this all works, starting with the spreadsheet.
Example: Analyzing Death Penalty Data in tabular format. Using our dataset on death penalty status across various countries, we can ask GPT-4o to interpret the data fields:
And the results from our prompt:
If we take a manual look at the dataset, this interpretation is entirely accurate. Even the COWCODE (the country code) field has been interpreted correctly by GPT-4o.
This is pretty impressive.
2. Creating Data Visualizations
Once we know which fields have values, we can now prompt GPT-4o to generate several types of visualizations using libraries like Matplotlib, Plotly, and Pandas.
These libraries allow for the creation of charts, graphs, and heatmaps that provide a visual representation of the data.
Example: Time-Series Line Chart for Death Penalty Trends To get a sense of how the death penalty has “trended” over time, we can ask GPT-4o to create a time-series line chart showing the trend of countries that have not abolished the death penalty over the last 100 years.
Here is our prompt to GPT-4o and the response:
This is where GPT-4o really shines. It can create on-the-fly classic data visualizations like line and bar charts — no extra prompts or coding are necessary.
3. Basic PDF Generation
Another significant strength of GPT-4o is generating PDFs that include both text and basic data visualizations.
Using libraries like FPDF and ReportLab, GPT-4o can create detailed reports, embedding charts, tables, and written analysis (more on this below).
Data Viz Reporting — Where Does GPT-4o Fall Short?
One of my biggest frustrations with recent updates to GPT-4o is that the LLM has lost its ability to generate on-the-fly mapping data visuals.
With earlier versions (ie. in 2024) this functionality worked. You could ask GPT-4 to create a map image and include it in a PDF file — and it would work great!
So what happened here? GPT-4 lost its ability to work with GeoPandas data
For examplel, when attempting to create a map using GeoPandas to show the global status of the death penalty, an error is generated:
Error: "Multi-part geometries do not themselves provide the array interface."
This error, related to how GeoPandas handles complex geometries, prevented the successful generation of the map.
So what can you do if you want to include maps along with your charts in your PDF reports?
Let me show you a simple and awesome workaround!
A Practical Workaround for Map Generation
To solve the issue of automatic map image generation challenge we need to perform a few additional steps outside the GPT-4o environment.
But first, we can ask GPT-4o to create interactive HTML maps that can be viewed in a typical web browser:
GPT-4 first provides a tabular view of the data file:
Using the knowledge that GPT-4o has, we can request map creation in the form of an HTML file (one for the year 1970 and another for the year 2020):
If we click on one of the links (for example, the map for 2020) we can load the file into our browser:
Next, we can take a screenshot for each map and save them locally as PNG files. Next, we can upload the files to GPT-4o and prompt the tool to generate a detailed analysis in the form of a PDF report:
Providing detail in the request ensures that GPT-4o will give a more detailed and relevant response.
Notice that the request tells the LLM to be a “data analyst”. This gives the tool a role to play.
By asking for a “detailed professional analysis” with GPT-4o as a data analyst, there is a higher probability that GPT-4o gives us an adequate response.
The more detail that you can provide in the prompt, the better. The response from GPT-4:
Alright! We are provided with a link to click on to download the PDF file. We can then open the file to view the full report:
Not bad. This is a terrific template to getting started on some more in-depth analysis — we can add/modify the information as needed.
So what is my overall experience with the evolution of the automatic PDF-generation tools is that are available in GPT-4o?
They are definitely getting better — albeit slowly.
In Summary…
GPT-4o offers tools for generating PDF reports from CSV data that include many different types of data visualizations. And it can create this “on the fly” with no additional steps or coding required.
What GPT-4o Does Well:
Data Extraction & Analysis: Efficiently reads and processes structured data from CSV and Excel files, enabling easy creation of data visuals.
Time-Series & Statistical Visualization: Produces a plethora of data visuals using libraries like Matplotlib, Plotly, and Altair.
Report Generation: Generates semi-professional PDF reports that integrate visualizations, narrative and statistical commentary.
What GPT-4o Does NOT Do Well:
Static Map Generation: No ability to create on-the-fly static choropleth or thematic maps for inclusion in PDFs.
Geospatial Library Issues: Always generates errors when handling complex geometries, such as with GeoPandas
Report Generation: GPT-4o absolutely cannot do in-depth analysis and data storytelling on data visualizations that it creates.
So with a proper setup and careful prompting, GPT-4 can provide a simple data reporting solution that includes relevant maps, visuals, and basic narrative.