
Interactive Mapping Tutorial With Python: Visualizing US Education Trends
Python Folium, Plotly, and Dash libraries for effective display

Python Folium, Plotly, and Dash libraries for effective display
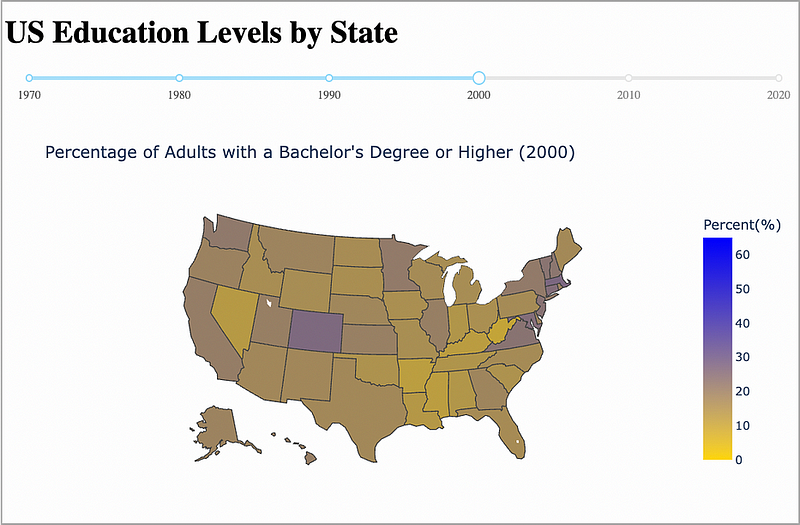
Data visualization skills are essential for today’s data analysis requirements — and the skill to create maps is a great tool to have in your visualization toolbox.
In this step-by-step article, we’ll use Python to…
Keep reading with a 7-day free trial
Subscribe to Data at Depth to keep reading this post and get 7 days of free access to the full post archives.