Data at Depth

Data at Depth

Share this post

Data at Depth
Data at Depth
ChatGPT’s Magic Touch: Python Dashboards with Prompt Engineering
Copy link
Facebook
Email
Notes
More

ChatGPT’s Magic Touch: Python Dashboards with Prompt Engineering

Creating complex data visualizations with ease

John Loewen's avatar
John Loewen
May 14, 2023
∙ Paid

Share this post

Data at Depth
Data at Depth
ChatGPT’s Magic Touch: Python Dashboards with Prompt Engineering
Copy link
Facebook
Email
Notes
More
Share

Creating complex data visualizations with ease

Python Plotly Dash app with a slider (by Year), updating both map and bar chart.

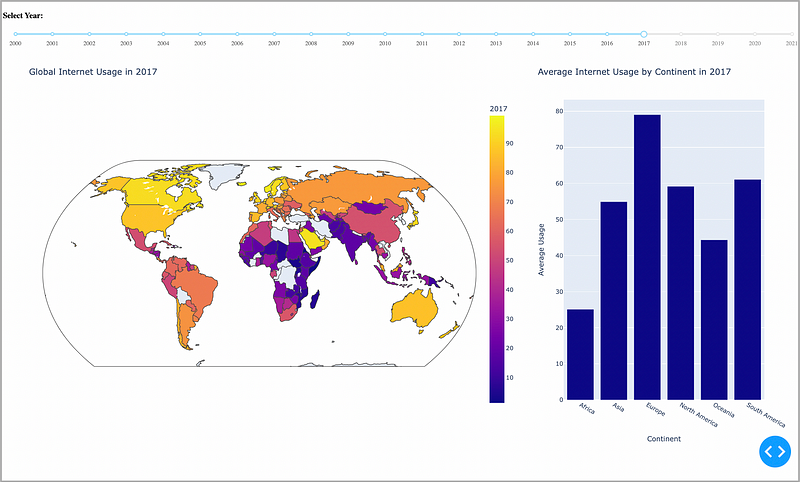
ChatGPT is revolutionizing how we create complex data visualizations, letting us harness the power of Python without getting tangled in syntax.

But there’s a secret sauce to making this all work — prompt engineering. Crafting just…

Keep reading with a 7-day free trial

Subscribe to Data at Depth to keep reading this post and get 7 days of free access to the full post archives.

Already a paid subscriber? Sign in
© 2025 John Loewen
Privacy ∙ Terms ∙ Collection notice
Start writingGet the app
Substack is the home for great culture

Share

Copy link
Facebook
Email
Notes
More