Data at Depth

Data at Depth

Programming

Beautiful Charts with Python Pygal for Visualizing UNHCR Displacement Data

A simple tutorial using one of the lesser-known Python data visualization libraries

John Loewen's avatar
John Loewen
Dec 13, 2024
∙ Paid

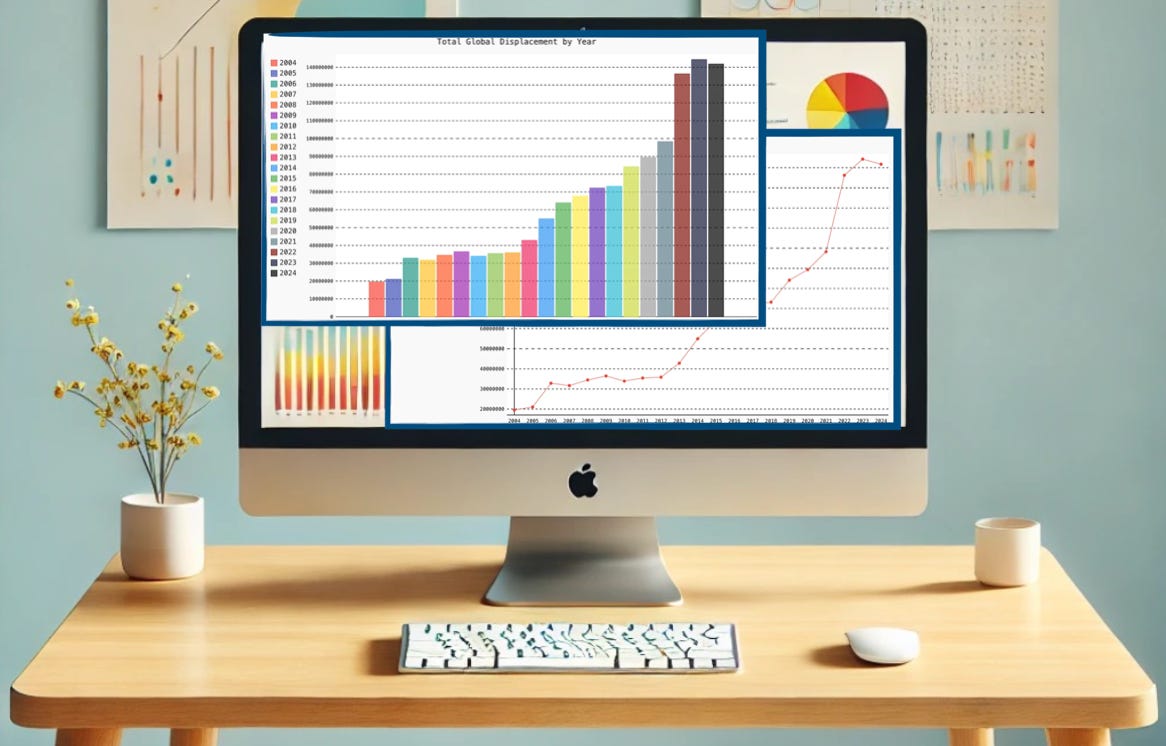
Data visualization is an important tool for communicating analysis from complex datasets.

Among the many Python libraries available for visualization, Pygal is a terrific option for generating high-quality, interactive charts in SVG format.

Data at Depth is a reader-supported publication. To receive new posts and support my work, consider becoming a fre…

User's avatar

Continue reading this post for free, courtesy of John Loewen.

Or purchase a paid subscription.
© 2025 John Loewen · Privacy ∙ Terms ∙ Collection notice
Start your SubstackGet the app
Substack is the home for great culture