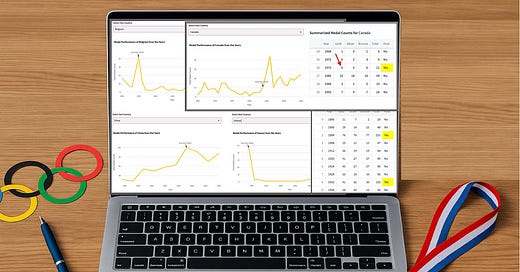
A Streamlit Prototyping Tutorial: Olympic Medal Trends Made Remarkably Simple
Using Python data analysis to see if Olympic countries outperform when hosting
Streamlit is one of the most powerful tools for rapid prototyping and data visualization.
Its ease of use and flexibility make it an ideal choice for data scientists and analysts looking to quickly turn raw data into interactive web apps.
Three of the ways in which this process is expedited are:
eliminating the need to know HTML for laying out and managing the web content
seamless integration of major Python data visualization libraries (for example, Plotly)
simplifying deeper storytelling through annotations (via Plotly).
Using a fun dataset on Olympic medal counts, let me show you some examples of how this works.
The Data Set
Hosting the Olympics is a prestigious event that often comes with significant national investments. These investments include building new sports facilities and improving existing infrastructure to enhancing athlete training programs and hiring top-tier coaches.
Given these efforts, it is interesting to see whether the host country’s medal performance improves during the years they host the Olympics compared to other years.
The data used to accomplish this task is the “Olympic Medals by Country” dataset. It is available on Kaggle, HERE.
In this data set, the data is organized by year, country, and a count of “Gold”, “Silver” and “Bronze” medals. Here is a screenshot of the first 15 rows of the dataset:
Now let’s start to set up our Python Streamlit application code.
Data Loading and Initial Setup
The dataset containing Summer Olympic medal counts is loaded using Pandas. The application title and subheader are set up using Streamlit.
import streamlit as st
import pandas as pd
import plotly.express as px
# Load the dataset
data = pd.read_csv('Summer_olympic_Medals.csv')
st.subheader('Host Country Impact on Olympic Medal Performance')
To ensure this code will work, make sure you have installed the three necessary libraries: Streamlit, Pandas, Plotly.express.
Next, we can load the dataset file using the Pandas read_csv library, and we’re good to go!
User Inputs for Filtering Data
Users can select a host country from a dropdown menu. The dataset is then filtered to separate data for the selected host country and the years it hosted the Olympics.
# Filter by Host Country
host_country = st.selectbox('Select Host Country', sorted(data['Host_country'].unique()))
# Filter data for the selected host country
host_data = data[data['Host_country'] == host_country]
country_data = data[data['Country_Name'] == host_country]
# Extract years the country hosted the Olympics
host_years = host_data['Year'].unique()
A brief code explanation:
st.selectbox()
: Creates a dropdown menu for selecting a host country.data[data['Host_country'] == host_country]
: Filters the dataset to include only rows where the selected country was the host.data[data['Country_Name'] == host_country]
: Filters the dataset to include only rows where the selected country participated.host_data['Year'].unique()
: Extracts the unique years the selected country hosted the Olympics.
Summarizing Medal Counts
Medal counts are summarized for the selected host country. The total medal count is calculated by summing gold, silver, and bronze medals.
# Summarize medal counts for the host country
medal_counts = country_data.groupby('Year')[['Gold', 'Silver', 'Bronze']].sum().reset_index()
medal_counts['Total'] = medal_counts['Gold'] + medal_counts['Silver'] + medal_counts['Bronze']
A brief code explanation:
country_data.groupby()
: This function groups the data by year and calculates the sum of gold, silver, and bronze medals for each year, then resets the index.medal_counts['Total'] = medal_counts['Gold'] + medal_counts['Silver'] + medal_counts['Bronze']
: Adds a new column 'Total' that represents the total medal count for each year.
Now that we have our data frame structured, we can start visualizing the data with Plotly and Streamlit
Visualizing Data with Plotly
Alright, now let’s quickly visualize the impact of hosting on the total medal count with Python Plotly and Streamlit.
A line chart is created to visualize the total medal counts over the years. The line is colored gold and made thicker to highlight the performance. Annotations are added to indicate the host years.
# Create a line chart to compare total medal counts
fig = px.line(medal_counts, x='Year', y='Total',
labels={'Total': 'Total Medal Count'},
title=f'Medal Performance of {host_country} Over the Years')
# Update line color to gold and line width to 3 pixels
fig.update_traces(line=dict(color='#f5ce0a', width=4))
A quick code explanation:
px.line()
: Creates a line chart using Plotly Express to visualize the total medal counts over the years.fig.update_traces()
: Updates the line color to gold and sets the line width to 4 pixels.
Perfect! Now lastly, let’s add in some additional context with annotations!
Adding in Data Storytelling Annotations
Adding annotations in Streamlit is super-duper simple with Streamlit. To add some additional context to our data viz:
# Add annotations for host years
for year in host_years:
fig.add_annotation(x=year, y=medal_counts[medal_counts['Year'] == year]['Total'].values[0],
text=f"Host Year ({year})", showarrow=True, arrowhead=2)
st.plotly_chart(fig)
A quick code explanation:
fig.add_annotation()
: Adds annotations to the chart to highlight the years the selected country hosted the Olympics.st.plotly_chart(fig)
: Displays the Plotly chart in the Streamlit app.
Adding Host City and Year Information
Host city and year information is displayed above the chart for additional context.
# Add Host city and year as text above the chart
host_cities_years = host_data[['Year', 'Host_city']].drop_duplicates().reset_index(drop=True)
host_cities_years_text = ', '.join([f"{row['Host_city']} ({row['Year']})" for _, row in host_cities_years.iterrows()])
st.write(f"**Host Cities and Years:** {host_cities_years_text}")
A quick code explanation:
host_data[['Year', 'Host_city']].drop_duplicates().reset_index(drop=True)
: Extracts unique combinations of host cities and years from the filtered dataset.', '.join([f"{row['Host_city']} ({row['Year']})" for _, row in host_cities_years.iterrows()])
: Formats the host cities and years into a readable string.st.write(f"**Host Cities and Years:** {host_cities_years_text}")
: Displays the host cities and years as formatted text in the Streamlit app.
Highlighting Host Years in the Data Table
The summarized medal counts are displayed in a table with host years highlighted for easy identification.
# Highlight host years in the table
medal_counts['Host'] = medal_counts['Year'].apply(lambda x: 'Yes' if x in host_years else 'No')
st.write(f'**Summarized Medal Counts for** {host_country}')
# Define a function to highlight the rows where the country was the host
def highlight_hosts(s):
return ['background-color: yellow' if v == 'Yes' else '' for v in s]
styled_data = medal_counts.style.apply(highlight_hosts, subset=['Host'])
st.dataframe(styled_data)
A quick code explanation:
medal_counts['Host'] = medal_counts['Year'].apply(lambda x: 'Yes' if x in host_years else 'No')
: Adds a new column 'Host' to indicate whether the year was a host year for the selected country.st.write(f'**Summarized Medal Counts for** {host_country}')
: Displays a subheader for the summarized medal counts table.def highlight_hosts(s): return ['background-color: yellow' if v == 'Yes' else '' for v in s]
: Defines a function to highlight rows where the country was the host.medal_counts.style.apply(highlight_hosts, subset=['Host'])
: Applies the highlighting function to the 'Host' column.st.dataframe(styled_data)
: Displays the styled DataFrame in the Streamlit app.
For a great set of results, we can look at the United States, who have had the privilege of hosting the Summer Olympics on four (4) occasions. Our chart with annotations showing each of the 4 host years:
We can clearly see a spike on three of the four hosting occasions. Below the chart, the same data (in raw numbers) is represented in tabular format:
The user has the ability to scroll through the results to see the actual gold/silver/bronze medals won by that country in non-host vs. host years.
Does Hosting An Olympics Lead to Better Results?
So, does hosting an Olympics lead to better results for the host country’s athletes? Here are some results:
We can see that for Belgium, Brazil, China, and Greece, there were huge increases in medals compared to previous Olympiads.
Increased medal counts is a very common trend for hosting countries.
Sadly, the one major exception to this is my home country of Canada:
As hosts of the 1976 Olympic Games in Montreal, Canada holds the unenviable distinction of being the only country of the Summer Olympiad to not win a gold medal while hosting. It seems we peaked a little late, as the results of the 1984 Olympics in Los Angeles show.
The great thing about Streamlit is that it is a breeze to add in more Plotly visualization functionality using the multitude of built-in methods.
For example bar charts, pie charts, scatterplots, and chororopleth maps.
And that’s all there is to it! Hope it was as a quick and easy process for you!
In Summary
Streamlit and Plotly prove to be immensely effective tools for quickly prototyping data sets in an interactive and user-friendly manner.
By visualizing the data, we can see a clear trend in how hosting the Olympics positively impacts the host country’s performance.
And the results? Our quick prototyping analysis reveals that hosting the Olympics often leads to better performance in terms of total medal count for the host country.
Super!