Data at Depth

Data at Depth

Share this post

Data at Depth
Data at Depth
A Simple Interactive Olympic Medal Tally Interface with Streamlit and Plotly
Programming

A Simple Interactive Olympic Medal Tally Interface with Streamlit and Plotly

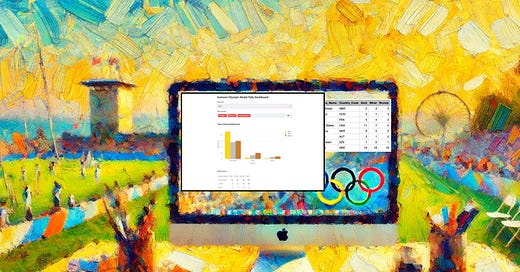
Tracking historical summer olympic medal counts by country

John Loewen's avatar
John Loewen
Jul 22, 2024
∙ Paid
3

Share this post

Data at Depth
Data at Depth
A Simple Interactive Olympic Medal Tally Interface with Streamlit and Plotly
1
2
Share

Streamlit is a Python application framework that allows coders and data scientists to quickly create interactive web applications.

Combined with a data visualization library like Plotly, you can create beautiful charts and maps from data sets (ie. CSV files) with only a few lines of code.

Data at Depth is a reader-supported publication. To receive new pos…

Keep reading with a 7-day free trial

Subscribe to Data at Depth to keep reading this post and get 7 days of free access to the full post archives.

Already a paid subscriber? Sign in
© 2025 John Loewen
Privacy ∙ Terms ∙ Collection notice
Start writingGet the app
Substack is the home for great culture

Share