

How Good is GPT-4 Now With Data Visualization Report Generation?
How Good is GPT-4 Now With Data Visualization Report Generation?
The current state of affairs with automatic data visualization reporting


GPT-4, as a powerful language model, can easily analyze data, create data visualizations, and generate reports from structured datasets.
For example, you can ask the LLM to access and provide information about fields in CSV and XLSX files and it will respond quickly and accurately.
However, while it excels in many areas of data manipulation and reporting, it also has specific limitations.
Let’s take a look together at what GPT-4 does well in this domain and where it suffers, all with practical examples using a current global development dataset.
The Dataset
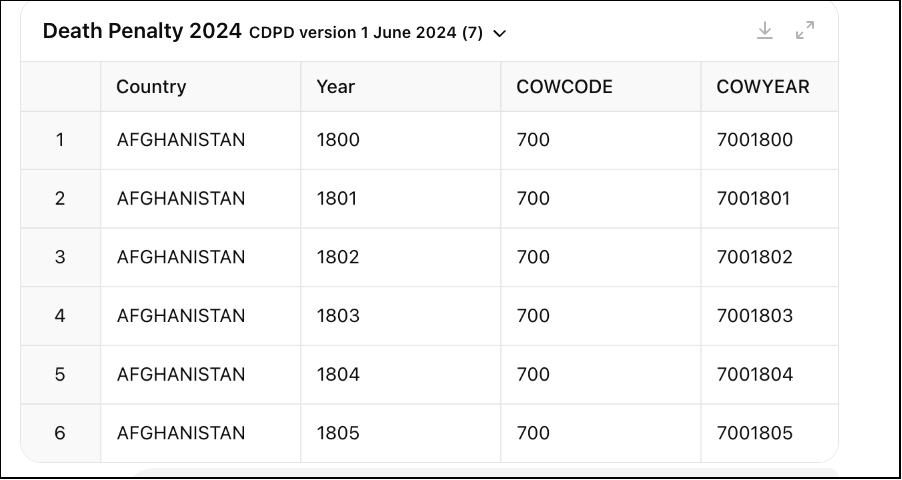
The Harvard Comparative Death Penalty Database provides a global yearly categorization of death penalty status. It includes both historical and modern data, allowing us to track how the use of the death penalty has changed globally over time.
The dataset can be downloaded HERE.
Bringing death penalty data to life shows us where the world stands on one of the most controversial practices in the legal system. Some countries have moved away from the death penalty while others still hold on.
Using this real-life dataset as our source, let’s take a deeper look at how GPT-4 capabilities can be leveraged to automate some data visualization generation and reporting tasks.
Data Viz Reporting — What Can GPT-4 Do Well?
1. Reading and Analyzing CSV Data
One of the key strengths of GPT-4 is its ability to quickly read, interpret, and analyze data from CSV files.
Whether it’s a dataset containing happiness scores, death penalty data, or any other structured format, GPT-4 can parse the CSV file and make the data accessible for further analysis and visualization.
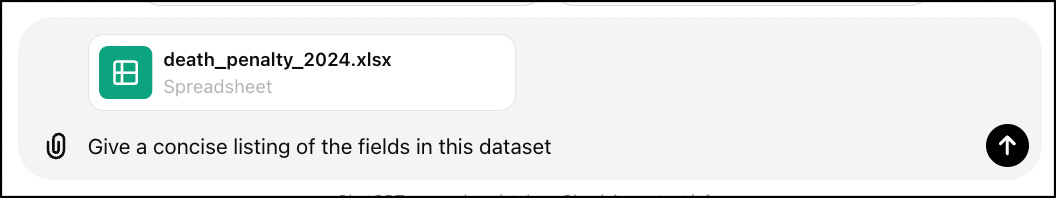
Example: Analyzing Death Penalty Data in tabular format. Using our dataset on death penalty status across various countries, we can ask GPT-4 to interpret the data fields:
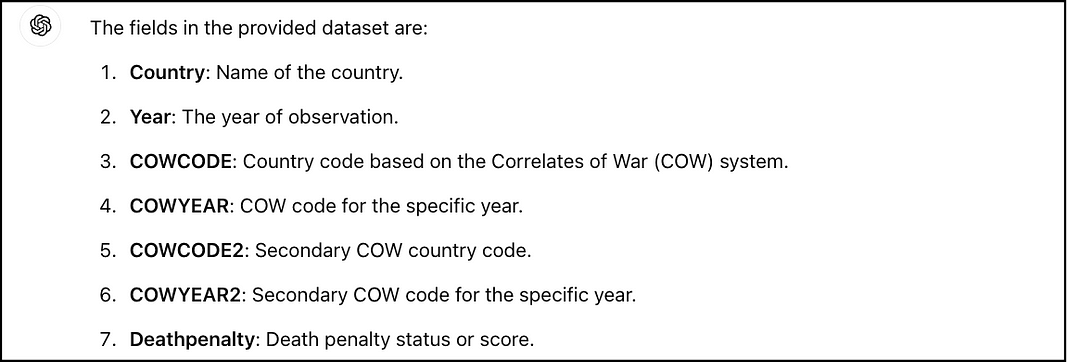
If we take a manual look at the dataset, this interpretation is entirely accurate. Even the COWCODE field has been interpreted correctly by GPT-4.
This is pretty impressive.
2. Creating Data Visualizations
Once the data is extracted, GPT-4 can generate several types of visualizations using libraries like Matplotlib, Plotly, and Pandas.
These libraries allow for the creation of charts, graphs, and heatmaps that provide a visual representation of the data.
Example: Time-Series Line Chart for Death Penalty Trends To get a sense of how the death penalty has “trended” over time, we can ask GPT-4 to create a time-series line chart showing the trend of countries that have not abolished the death penalty over the last 100 years.
Here is our prompt to GPT-4 and the response:
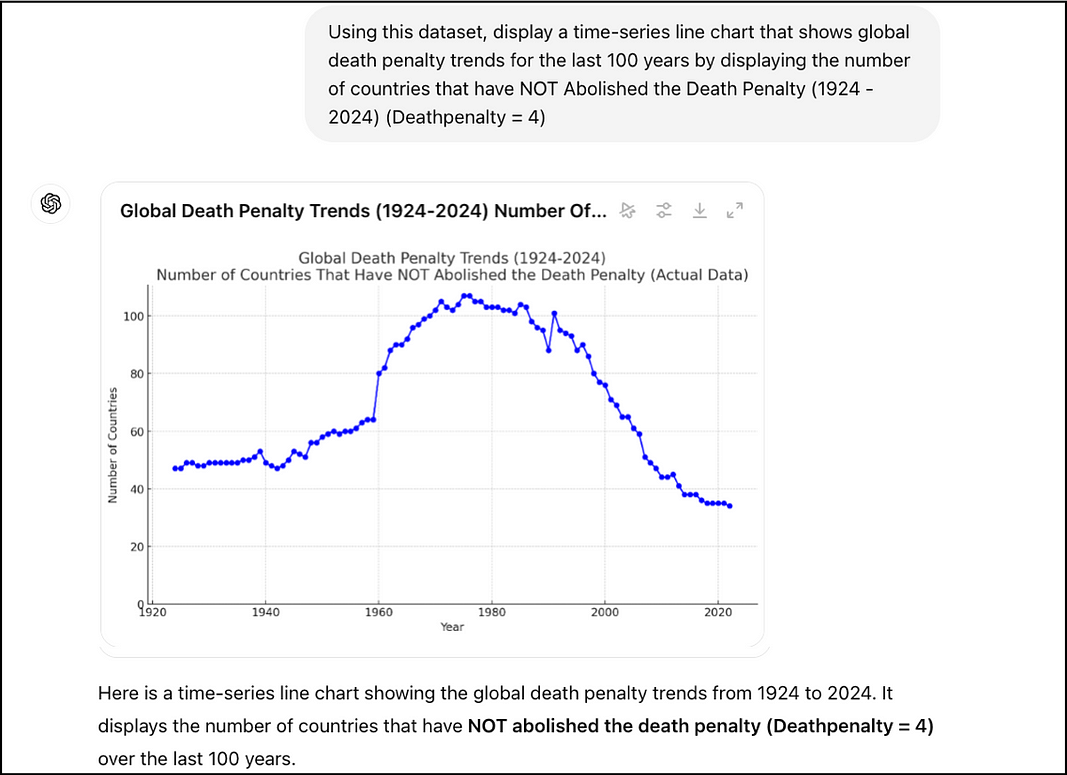
This is where GPT-4 really shines. It can create on-the-fly classic data visualizations like line and bar charts — no extra prompts or coding are necessary.
3. Basic PDF Generation
Another significant strength of GPT-4 is generating PDFs that include both text and basic data visualizations. Using libraries like FPDF and ReportLab, GPT-4 can create detailed reports, embedding charts, tables, and written analysis. For example, after analyzing the death penalty dataset, GPT-4 can output a PDF that includes textual analysis alongside charts showing trends in the data (more on this below)
Data Viz Reporting — Where Does GPT-4 Fall Short?
One of my biggest frustrations with recent updates to GPT-4 is that the LLM lost its ability to generate on-the-fly mapping data visualizations.
With earlier versions (ie. as of Jan/2024) this functionality worked. You could ask GPT-4 to create a map image and include it in a PDF file, it would work just fine. With GPT-4o, this is not possible.
1. Inability to Directly Generate Maps in PDFs
One of the most significant current limitations for data visualizations is GPT-4’s inability to generate static map images and embedding them directly into PDF reports. GPT-4 can generate interactive HTML maps using Plotly but it cannot convert these maps into static PNG images for inclusion in a PDF. Additional steps are required.
2. Complex Data Visualizations with Geopandas
GPT-4 cannot handle more advanced tools like GeoPandas for spatial data visualizations. When attempting to create a map using GeoPandas to show the global status of the death penalty, an error occurred related to multi-part geometries:
Error: "Multi-part geometries do not themselves provide the array interface."This error, related to how GeoPandas handles complex geometries, prevented the successful generation of the map.
So what can you do if you want to include maps along with your charts in your PDF reports?
Let me show you a simple workaround.
A Practical Workaround for Map Generation
An alternative approach to solving the issue of automatic map image generation challenges requires a few additional steps outside the GPT-4 environment.
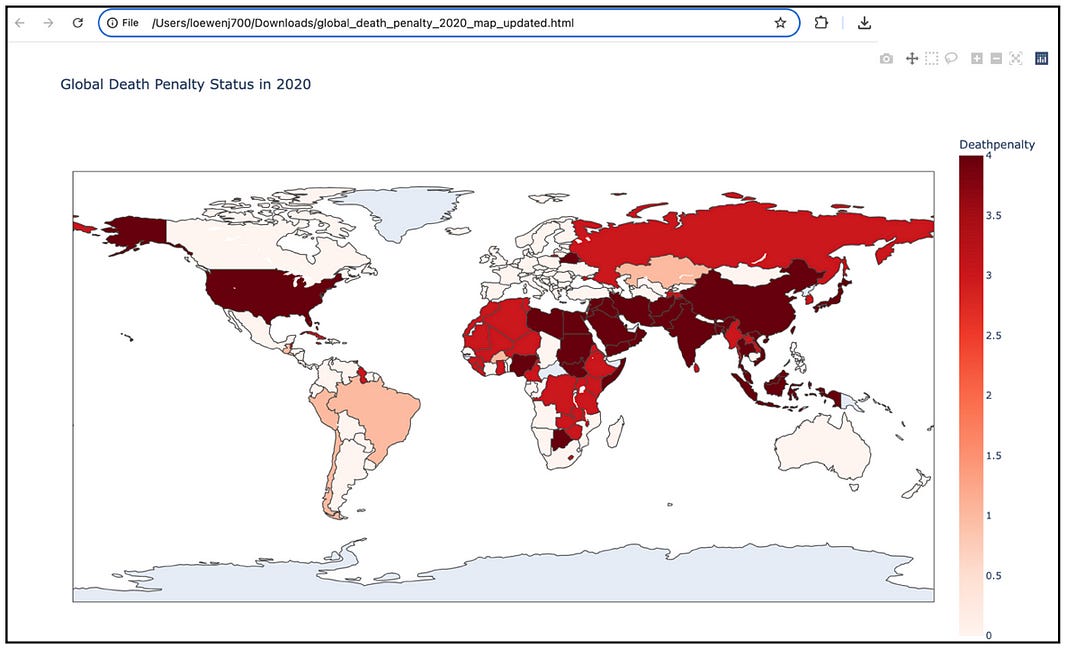
GPT-4 is able to create interactive HTML maps that can be viewed in a typical web browser. This is a recent positive development for this particular LLM.
For example, we can ask GPT-4 to access the data file that we have provided and to first interpret it:
GPT-4 first provides a tabular view of the data file:
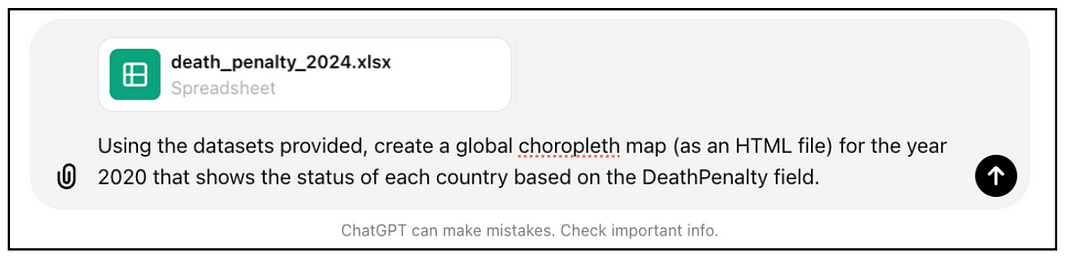
Using the knowledge that GPT-4 has, we can request map creation in the form of an HTML file (one for the year 1970 and another for the year 2020):
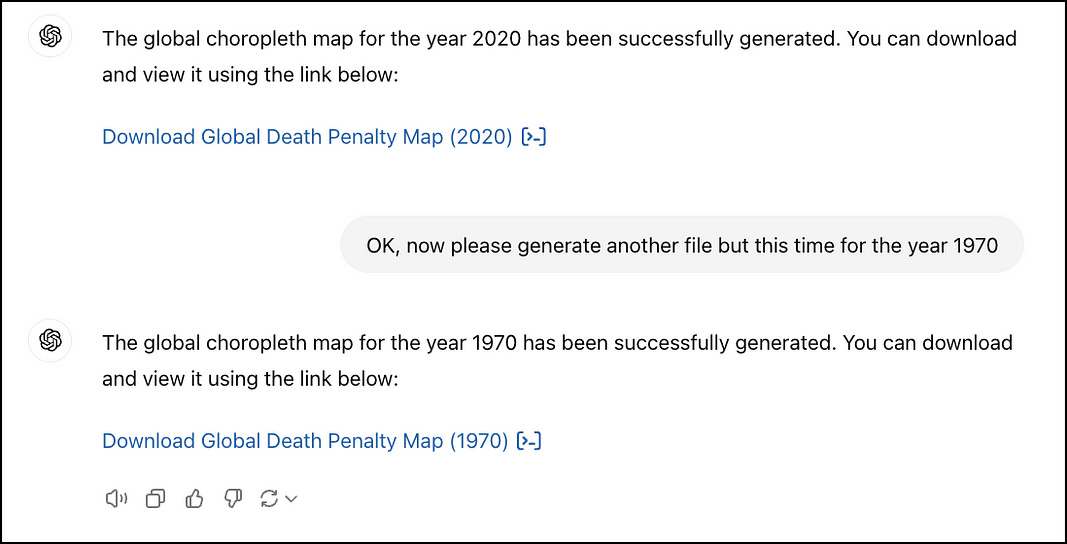
If we click on one of the links (for example, the map for 2020) we can load the file into our browser:
Next, we can take a screenshot for each map and save them locally as PNG files. Next, we can upload the files to GPT-4 and prompt the tool to generate a detailed analysis in the form of a PDF report:
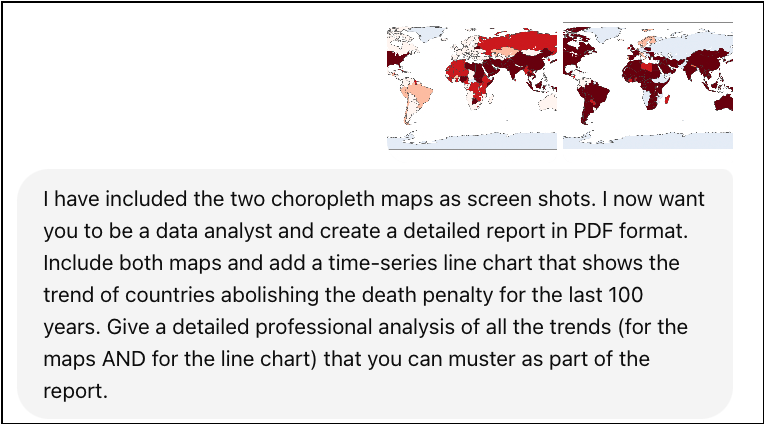
Providing detail in the request ensures that GPT-4 will give a more detailed and relevant response. Notice that the request tells the LLM to be a “data analyst”. This gives the tool a role to play. By asking for a “detailed professional analysis” with GPT-4 as a data analyst, there is a higher probability that GPT-4 gives us an adequate response.
The more detail that you can provide in the prompt, the better. The response from GPT-4:
Alright! We are provided with a link to click on to download the PDF file. We can then open the file to view the full report:
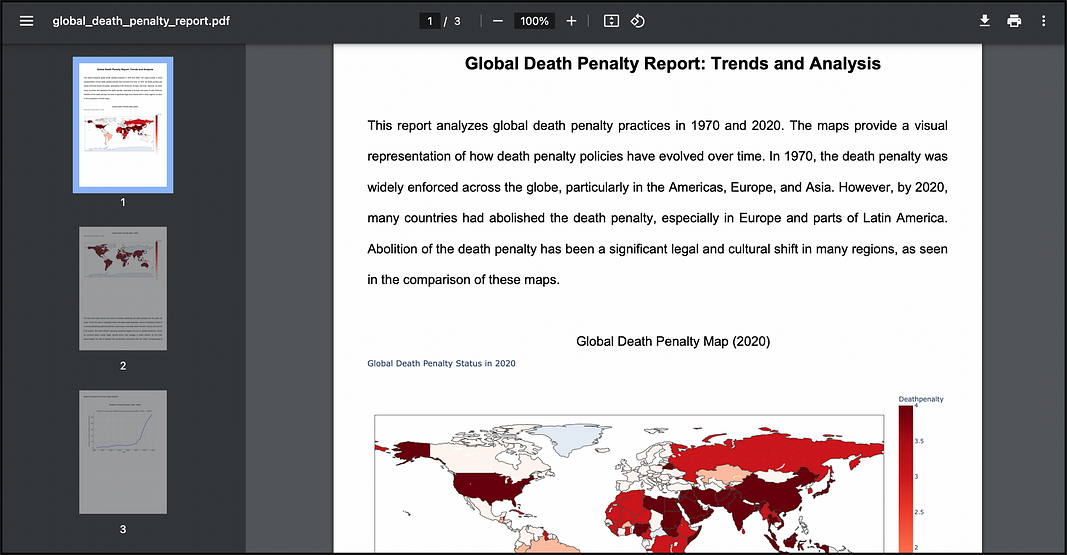
Not bad. This is a good starting point — we can add/modify the information as needed.
My experience with the GPT-4 automatic PDF-generation tools is that they are slowly getting better. Very slowly.
In Summary…
GPT-4 offers tools for generating PDF reports from CSV data that include many different types of data visualizations. And it can create this “on the fly” with no additional steps or coding required.
However, the integration of advanced features like static maps presents a challenge due to missing dependencies and library restrictions in certain environments.
What GPT-4 Does Well:
Extracting and analyzing CSV data.
Generating time-series charts and other data visualizations.
Creating semi-professional PDF reports that combine charts and analysis.
Challenges and Limitations:
Difficulties generating static map images for PDF inclusion.
Errors with GeoPandas and advanced geometry handling.
Lack of certain libraries required for exporting interactive visualizations to static images.
Integrating more complex visualizations like maps in a static format currently require additional tools or external resources.
With a proper setup and careful prompting, GPT-4 can provide a simple data reporting solution that includes the necessary maps and visualizations.
If this article is right up your alley, try my free 5-Day Email Course on Prompting GPT-4 for Data Visuals. Let me know what you think:
