

Four Essential Skills to Improve Your Python Data Visualization Workflow
Four Essential Skills to Improve Your Python Data Visualization Workflow
Here are 4 need-to-know skills for the modern Python coder to maximize productivity

Globally, 50% of programmers use Python as their programming language of choice. Of these, 46% use it for data analysis tasks (source: 2022 Statista report).
One of the most awesome aspects of Python is its ability to visualize data. However, this process can be quite complex and time-consuming.
What if there was a way to simplify the process for visualizing your data?
Here are 4 key skills you need to develop, and improve upon, to speed up your Python data visualization workflow.
1. Understanding Python Data Visualization Libraries
Familiarize yourself with Python’s data visualization libraries like Matplotlib, Seaborn, and Plotly. Each library has its unique strengths and use-cases.
For instance, Matplotlib is excellent for creating static, animated, and interactive plots in Python.
Seaborn, built on top of Matplotlib, provides a high-level interface for drawing attractive and informative statistical graphics.
Plotly, on the other hand, excels at interactive plots.
Examples:
Here’s a simple example of creating a line plot with Matplotlib:
import matplotlib.pyplot as plt
x = [1, 2, 3, 4, 5]
y = [1, 4, 9, 16, 25]
plt.plot(x, y)
plt.show()
For Seaborn, you can create a histogram like so:
import seaborn as sns
data = [1, 2, 2, 3, 3, 3, 4, 4, 4, 4]
sns.histplot(data)
plt.show()
And for Plotly, you can create an interactive scatter plot like so:
import plotly.express as px
df = px.data.iris() # iris is a pandas DataFrame
fig = px.scatter(df, x="sepal_width", y="sepal_length")
fig.show()
Mistake to Avoid: Don’t try to learn all libraries at once. Start with one, master it, and then move on to the next.
This way, you’ll build a solid foundation and avoid confusion.
2. Understanding Data Cleaning and Preprocessing
BOnce you have a basic idea of how to create visualizations, the next step is to gain an in-depth understanding of how to clean and preprocess a dataset.
Some common issues with datasets include handling missing values, removing duplicates, or transforming data.
This is where you need to have a basic understanding of the pandas library.
Pandas is a powerful data manipulation library in Python, and it is now the de-facto library for organizing datasets for visualization purposes.
Examples:
Here’s a simple example of handling missing values with pandas:
import pandas as pd
df = pd.DataFrame({"A": [1, 2, np.nan], "B": [5, np.nan, np.nan], "C": [1, 2, 3]})
df.fillna(value=df.mean(), inplace=True)
And to remove duplicates from your DataFrame:
df = pd.DataFrame({"A": [1, 2, 2], "B": [5, 5, 6], "C": [1, 2, 3]})
df.drop_duplicates(inplace=True)
Mistake to Avoid: Don’t skip the data cleaning step. Working with dirty data can lead to inaccurate visualizations and misleading insights.
Once you have an understanding of visualization basics AND of how to create a dataframe, you can put the two together.
For example, using a simple dataset on global happiness (found HERE), we can use pandas to access the dataset and then to create a simple line chart:
import pandas as pd
import matplotlib.pyplot as plt
# Load the dataset
df = pd.read_csv('happiness_years02.csv')
# Extract the data for Canada
canada_data = df[df['Country'] == 'Canada'].iloc[:, 1:8] # Selecting columns from 2015 to 2021
# Extract the years as they will be our x-axis
years = canada_data.columns
# Plotting
plt.figure(figsize=(10, 6))
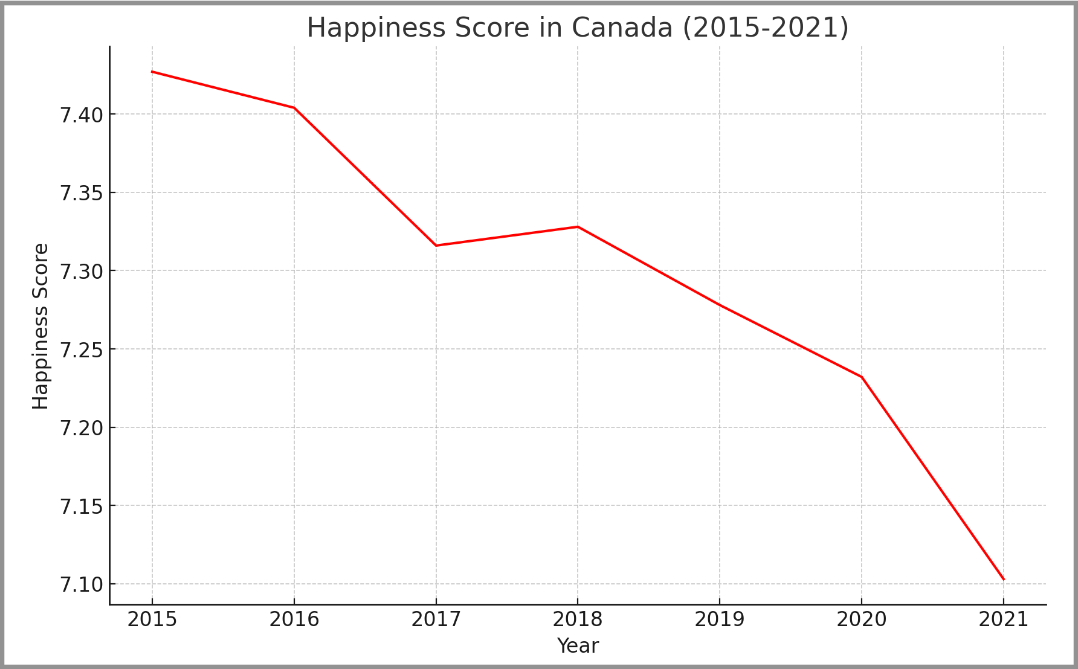
plt.plot(years, canada_data.iloc[0], linestyle='-', color='red')
plt.title('Happiness Score in Canada (2015-2021)')
plt.xlabel('Year')
plt.ylabel('Happiness Score')
plt.show()In the above code, we import the pandas and matplotlib libraries. Using pandas, we can access the data set using the built-in read_csv() function. Once we have a data frame, we can “slice” out the information for Canada using the iloc() function.
Once we have just the data for Canada, we can set up the years for our x-axis. Then we are ready to draw using the matplotlib plot() function. Add a title and labels, and Bob’s your uncle.
The resulting data visual:
3. Mastering Modular Prompting with ChatGPT
Modular Prompting with ChatGPT allows you to generate Python code snippets by providing specific instructions (prompts).
The first step here is to gain an understanding of how to structure your prompts effectively.
For example, if you want to generate a bar plot using Seaborn, your prompt could be “Generate a Seaborn bar plot for a DataFrame ‘df’ with ‘x’ on the x-axis and ‘y’ on the y-axis.”
Example: Here’s how you might use a prompt to generate a Seaborn bar plot:
ChatGPT Prompt: Generate a Seaborn bar plot for a DataFrame ‘df’ with ‘x’ on the x-axis and ‘y’ on the y-axis.
ChatGPT Response:
import seaborn as sns
sns.barplot(x='x', y='y', data=df)
plt.show()
Back to the example data from the previous section, if you have a license for GPT-4, you can upload the data file and ask GPT-4 to work it’s visualization magic.
You can click on the “attachment” icon to upload your file and then you can prompt away:
Here is a simple example:

GPT-4 happily churns out the working Python Plotly code (NOTE: you may need to adjust the path in the read_csv() function to point to your CSV file):
import plotly.graph_objects as go
import pandas as pd

# Load the dataset
df = pd.read_csv('happiness_years02.csv')

# only data for top 5 from 2015-2021
df_top5 = df.sort_values(by='2021', ascending=False).head(5)

# Create a figure to plot the data
fig = go.Figure()

# Loop through the top 5 countries
for index, row in df_top5.iterrows():
    fig.add_trace(go.Scatter(x=df.columns[1:8], y=row[1:8], mode='lines', name=row['Country']))

fig.update_layout(title='Happiness Score of Top 5 Countries (2015-2021)',
                  xaxis_title='Year',
                  yaxis_title='Happiness Score',
                  legend_title='Country')

# Show the figure
fig.show()
And the resulting data visualization (I ran this example from my PyCharm IDE):
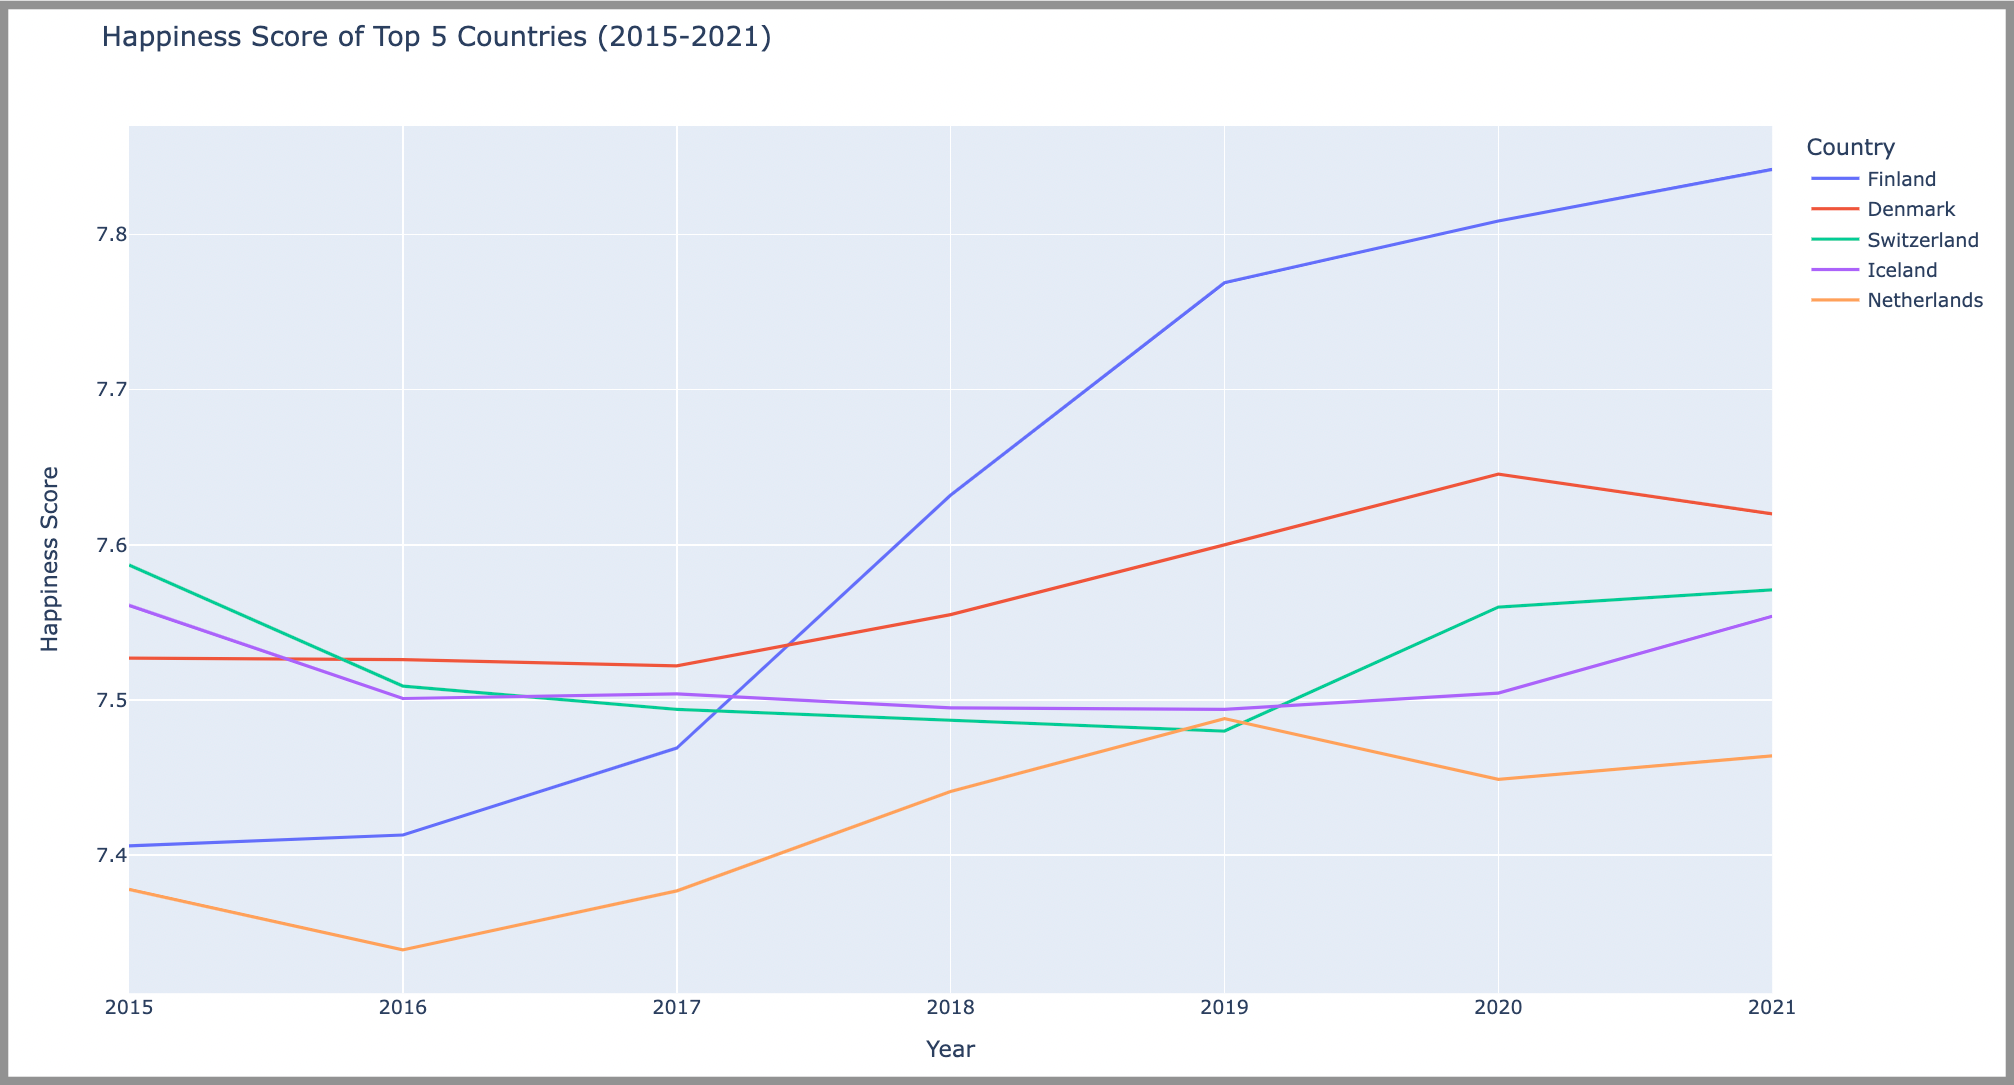
Yes, it really is that easy.
Mistake to Avoid: Avoid vague or overly complex prompts. The more specific and clear your prompt, the better the generated code will be. Make sure you progress in a modular fashion. This makes it easier to backtrack when needed.
4. Developing a Strong Foundation in Python
Actionable Tip: While Modular Prompting ChatGPT simplifies the coding process, a strong foundation in Python is still essential. This includes understanding Python’s syntax, control flow, and data structures.
Resources:
Codecademy’s Python Course: This interactive course covers all the basics of Python, from syntax and data types to control flow and functions. It’s a great starting point for beginners.
LeetCode: LeetCode offers a vast collection of coding challenges that can help you strengthen your Python skills. It’s particularly useful for practicing problem-solving and algorithmic thinking.
Python.org’s Official Documentation: The official Python documentation is a comprehensive resource that covers every aspect of the language. It’s a great reference guide for both beginners and experienced programmers.
Mistake to Avoid: Don’t rely solely on AI tools like ChatGPT to write your code. Use it as a tool to speed up your coding process, not as a crutch.
In Summary…
There is no single tool or skill that will drastically improve your data visualization skills. A well-rounded approach works best.
By spending time understanding Python’s visualization libraries, learning how to use Modular Prompting effectively, cleaning and preprocessing data, building a strong Python foundation, AND by continually learning, adapting, and pivoting to new tools, technologies, and ideas, you can simplify and speed up your Python data visualization coding process.
And then you can focus more on higher level thinking, on what you want your data visualizations to do, rather than immense amounts of time on trying to figure out how to make it.
Thank you for reading!
If you want to learn more about how to prompt engineer GPT-4 for Python coding, sign up for this free 5-day email course
